-->
Showing posts with label Kettle. Show all posts

Monday, 26 April 2010

Plugins and Kettle V4

Hi all,
A quick word to say that the following plugins are running fine with Kettle V4 :
  • imageQkr : Transformation plugin to create QRCodes coming from DBs.
  •  imageKgeocoding : Transformation plugin for geocoding addresses.
  • image krrd : Transformation plugin to feed RRD files (RTG …).

image The plugin SendToS3 (job plugin) is not working on Kettle V4 for the moment. Some AbstractMethodError is flying around. I have to find why and patch …
Vincent

Geocoding with Kettle : new plugin

Hi all,

The Kettle geocoding plugin is HERE.
But shhhhhh .... don't tell it too loud .... ;)
And give me feedback if you want new features, improvements, etc ...

Ps : some usefull infos about the API term of use here.

Vincent

Wednesday, 21 April 2010

GeoCoding with Kettle : new plugin

Hi all,
I created a plugin for geocoding addresses into Kettle v3.5. This plugin is using the google maps API. You can learn more about this API HERE.

What is Geocoding ?

According to wikipedia, geocoding is “the process of finding associated geographic coordinates (often expressed as latitude and longitude) from other geographic data, such as street addresses, or zip codes”. Normalization is the process to clean an input address and putit into a normalized, standardized format.
Reverse geocoding is the opposite : finding a complete address from GPS coordinates.
Raised relief map … a basic tool for geocoding.

The plugin

For the moment, it is a basic V1 release, but fully working. A lot more features are about to be added (advanced geocoding).
image
Here is the plugin screen, in Kettle. This is a basic screen as you can see. You need to enter the following :
  • GMapKey : your google map key. The geocoding works without it … well for me. But I recommend you to sign on for the API and use your Google key.
  • Input Address Field : the address field, from the incoming rows, on which you want to process the geocoding
  • Normalized address : give the column name in which the normalized address will be stored.
  • City Field : give the column name in which the city name will be stored.
  • GPS Coord Fields : give the column name in which the GPS Coordinates address will be stored.
image
Here is the main Kettle screen with a transformation sample.
image

Let’s see how it works

For the example above, I used 4 row creation steps to create 4 types of addresses (French, USA, Asia, Africa). Here is the output : a code, a raw adress (with typos and disorder) and a comment.
image
Let’s imagine now we want to normalize the Raw address content field and retrieve the corresponding GPS coordinates for each address. Let’s do it, we set up the plugin screen with the following informations : your GMap key, the “Raw address” input field and the names for the normalized address, the city field and the GPS coords.
image
Now we can plug everything and start the transformation. The plugin is asking for geocoding to the Google map API for each address. You will find the result set as follows :
image
The original fields are still here (Code, Raw Adress and Comment), but the plugin added 3 more fields according the names you set up previously (Norm_address, City and GPS_Coord). As you can see, the adress is normalized and formated, thanks to Google map API. The GPS coords are : lat / lng.

Limits

After some readings, I noticed you can ask for geocoding up to 15.000 time per day. This is a limitation of the Google map API. I didn’t try to go above 15.000 addresses / geocoding demands. I let you check this (create 15001 lines in the row creation steps …).

I want it

No problem. You can download the plugin HERE (plugin, xml file and icon) and test it. Like usual, everything is packed into a single jar using fatjar.

What’s next ?

This is a basic geocoding process. I’m currently working on something more powerfull, with more features : using all the API attributes, give ability to the user to choose which attributes he wants / doesn’t want, reverse geocoding … etc …
Please, if this plugin is usefull for you, tell me more about your needs. I will be happy to upgrade this plugin for your usage.

Monday, 12 April 2010

QRCode encoder with Kettle : new plugin

Hi all,

I’ve made a new Kettle plugin to answer to a specific need from one of my clients in retail industry : a QRCode encoder.

What is a QrCode ?

It is a matrix code created by Denso Wave, a japanese company. QR stands for “quick response” because of the high speed decoding process. Today, most of our mobile phones (ex : iPhone) can read (decode) these QRCodes and read the information within to feed an application (agenda, adress book …). Some companies use it for encoding inside a logistic process. These codes are also widely used in ads. More infos HERE.

image

One of the code above is mine. But which one ?

The Kettle plugin

I used the famoux ZXING java library to encode any data into a QRCode. This library is quite complete and powerfull, yet sometimes a bit difficult to install and understand (read the wiki). You can find it HERE.

The plugin is quite simple : a single screen holds all the needed informations.

image Here are the fields :

  • Step name : the step name.
  • QRColumn : the column you want to encode, coming from a previous step.
  • Size x : the X size of your generated QRCode file (recommanded : 128).
  • Sixe y : the Y size of your generated QRCode file (recommanded : 128).
  • Picture format : png or gif
  • Destination dir : the destination directory where all the pictures / QRCodes will be written.

Running the Plugin

Very simple. Have a look below to my sample transformation. A data input coming from a csv file (can be a query or anything else) and the plugin itself. The plugin will read all the incoming data from the QRColumn you specified and will create a file for each value. The generated files will have the same name but will have a counter in the filename, corresponding to the rownumber.

image

The generated files, from my examples, are now on my C:\, as specified in the plugin window.

image

I want it !

Ok, no problem, you can find the package HERE. As usual, everything is compiled with fat jar in order to have only one jar file. The package holds :

  • The plugin itself (+ xml file and icon file),
  • The data sample csv file,
  • My QRCode, to add me to your favorites ;)

Don’t forget to have a look to Pentaho and the new Kettle / PDI release 4.

Have fun and keep me informed about your usage / testing or new feature request.

Thursday, 8 April 2010

Plugin : Update RRD Tool with Kettle (Cacti, MRTG …).

Hi all,
This post will give you more details about my new Kettle plugin to feed RRDTools database.

What is RRDTool ?

According to Tobias Oetiker, RRDtool is the OpenSource industry standard, high performance data logging and graphing system for time series data. Use it to write your custom monitoring shell scripts or create whole applications using its Perl, Python, Ruby, TCL or PHP bindings.
You can learn more about RRDTools and Tobias Oetiker fantastic work on his homepage HERE.
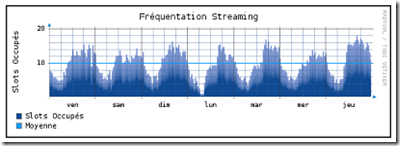
With RRDTools, you can easily store time series data and create realtime graphics like the one below. For instance, I use it today for one of my client on Paris in order to monitor various real time business / IT indicators : travel booking, passenger reservation, search engine sollicitation, xml proxy load and mainframe usage.
image

The libs I used

I used JRobin, a java port of Tobias Oetiker RRDTools. JRobin was made by the talented Sasa Markovic. The JRobin home page are HERE and HERE. I recommand a visit in order to be fully aware of all JRobin features.
According to Sasa Markovic, “JRobin is a 100% pure java implementation of RRDTool's functionality. It follows the same logic and uses the same data sources, archive types and definitions as RRDTool does. JRobin supports all standard operations on Round Robin Database (RRD) files: CREATE, UPDATE, FETCH, LAST, DUMP, XPORT  and GRAPH. JRobin's API is made for those who are familiar with RRDTool's concepts and logic, but prefer to work with pure java. If you provide the same data to RRDTool and JRobin, you will get exactly the same results and graphs.”
I confirm everything.
The graphical rendering is very good looking as you can see below.


The plugin

First, I recommand to read carefully everything related to RRDTools and JRobin. You must be familiar with this technology first.
The Kettle plugin is quite simple : a single user interface to create a RRD file, add archives and feed the file.
image
image A short description of this window :
  • Nom étape (sorry in french, will be translated) : Step name
  • RRD File : the RRD file to be created. This file will hold all your time series data and archives.
  • Datasource : an RRD file can have 1 or more datasource. For the moment, my plugin is restricted to 1 datasource, which is most of the time enough.
  • Type :
    • Gauge : Does no store the rate of change, it saves the actual value itself.
    • Counter : To store the rate of change of the value over a step period (assume the value is always increasing). Ex : traffic counters.
    • Derive : The same as Counter, but will handle negative values. Ex : free disk space.
    • Absolute : To store the rate of change, but the previous value is set to 0.
  • Heartbeat : If the RRD file does not receive value (PDP) within 300 seconds, it will wait for another 300 seconds (total = 600 seconds). If no value after 600 seconds, the flag UNKNOWN will be stored.
  • Starttime : The unix timestamp as the RRD file starting point. Must be a unix timestamp. In a future release, I will code a converter and place it into the user interface. You can easily compute unix timestamps by using this web page or this one. This timestamp must be lower than the one coming from your data.
  • Min and Max : The minimum value and the maximum value, if predictable.
  • The combo zone : This combo gadget will be used to define RRA : Round Robin Archives. An RRA will define how the consolidated data is stored. We have 4 major parameters :
    • CF, for Consolidation Function :
      • AVERAGE : Store the average value
      • MIN : Store the minimum value
      • MAX : Store the max value
      • LAST : Store the last known value
    • xff : XFile factor. This is the percentage of values that can be unknown without making the recorded value flagged as UNKNOWN. Must be between 0 and 1, with 0.1 intervals.
    • Steps :  Number of values to be consolidated, regarding the chosen CF. Must be integer.
    • Rows : Number of samples to keep. Must be integer.
The Add button will add the RRA (round robin archive) in the combo list, and then will be used for the RRD file creation.
Once the RRD file is successfully created, you will see a little message on botton of the user interface.
image
Let’s have a look to some RRD file internals, using another nice tool from Sasa Markovic : RRD inspector. I’m sure you will easily understand the RRD structure, if you are not already familiar with RRDTools.
The above screen shows us a RRD file created with one datasource called Speed, using a type GAUGE with a heartbeat of 600 seconds, with minimum and maximum values set to 0 to 2000. image
This RRD file also has a unique RRA (round robin archive), using the AVERAGE consolidation function, with xff set to 0.5, 1 step (compute each value = no average in fact) and 24 rows.This file has been created using the Kettle plugin on my C:\ harddrive.image
If we select then panel “Archive data” we will be able to see all the values currently stored into the RRD file.image
RRD inspector is a fantastic little tool, very usefull when creating RRD files and checking everything is well done.

How to use the plugin ?

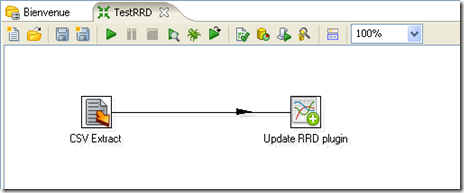
Very simple. First you create a RRD File using the user interface shown above. Then you have to control the file has been created, just to be sure. Finally, you can connect the step to a previous one in Kettle. In my example, I used a flat file containing some simple timestamps and values.
Here is my flat file : a unix timestamp with 5 mins intervals (starting Thu, 8 Apr 2010 12:00:00 UTC) and some simple values from 5 to 140.
TimeStamp;Value
1270728000;5
1270728300;10
1270728600;15
1270728900;20
1270729200;25
1270729500;40
1270729800;50
1270730100;60
1270730400;70
1270730700;80
1270731000;90
1270731300;100
1270731600;120
1270731900;140
And here is my sample transformation.
image
Hit play, and voilà … the plugin will feed the RRD file and give you a nice output log for each value. To be short : a RRD file is only expecting a unix timestamp and a value.
image

Generating a graph

Well, this is not really Kettle oriented, but I will give you some code to create graphics from your RRD file, previously loaded with Kettle.
This simple java snippet …
public static void RenderRRDGraph(long TimeStart, long TimeStop, String Consol, String RRDGraphFormat) throws IOException, RrdException{
    //Create gif graph
    RrdGraphDef graphDef = new RrdGraphDef();
    graphDef.setVerticalLabel("m/s");
    graphDef.setTimeSpan(TimeStart, TimeStop);
    graphDef.datasource("myspeed", "C:\\testRRD", "speed", Consol);
    graphDef.line("myspeed", new Color(0xFF, 0, 0), null, 2);
    graphDef.setFilename("C:\\testRRD." + RRDGraphFormat);
    RrdGraph graph = new RrdGraph(graphDef);
}
testRRD
… will create this png.
Very simple as you can see (well this example is really really simple compared to what we can really do, but I can’t give you any snapshot of the graphs I did for my client – I have NDA on this). You can imagine now creating some real time graphics (RTG) using this technology.

The package

Let’s go back to Pentaho and Kettle : I created a package for you. You will find the plugin itself (compiled and archived under Eclipse using Fat Jar in order to embedd the JRobin library, the icon, the xml file, the flat file and a sample transformation (the one described above).
This package can be donwloaded on its Google code page.
Please keep me informed about your testing, and feel free to contact me if further features (or fixes !) are needed.

Monday, 22 March 2010

Kettle job plugin : send files to Amazon S3

Hi all,

I created a job plugin for Kettle for file sending to Amazon S3. You can download this plugin here. It is based on Jets3 toolkit (jets3t-0.7.2). You can download the plugin HERE.

Below is the plugin GUI, as well as an example and you can also see the log output.

The plugin needs :

  • Access Key : Your S3 access key. You must have a S3 Account.
  • Private Key : Your private key. This key won’t be displayed in the Kettle log output.
  • S3 Bucket : A bucket is like a directory. It must be existing.
  • Filename : The path and filename for the file you want to send to S3.

Spoon_workbench

Once pushed in Amazon S3, you can see your file in the target bucket (here, a stupid win dll was sent).

File_in_S3

And, this is the job icon.

SS3

I will soon add some new features like : bucket creation in the UI, bucket listing, xml parsing for S3 return code and maybe encryption.

Feel free to contact me.

Monday, 15 March 2010

WIP : New book about Kettle

Hi all,

I'm excited (not usual for a Monday morning) to give you this info / link to Roland Bouman's blog.
He - with Matt Casters and Jos Van Dongen - is preparing a book about Kettle ! Everything you ever wanted to know about sex … sorry … about Kettle will there !
Wait until September 2010 ....

More infos here :
http://rpbouman.blogspot.com/2010/03/writing-another-book-pentaho-kettle.html

Wednesday, 10 March 2010

Currency repository with kettle

Hi all,

Today, I had to create a currency repository for one of my client in financial services. Easy with Informatica connected to one of the real time financial interfaces (Bloomberg, Reuters, etc …). The challenge was to gather data for all major currencies and store the Euro exchange rates over time. Easy I as said. It was done in no time.

Then, on coffee time, I thought : “How to do that with Kettle, with a complete free approach ?”. Here again, easy. Let me explain.

The data sources

From 2003 to 2005, I worked for the very official French National Bank (Banque de France - BDF) and the European Central Bank (ECB). Since that time, I still have a lot of links and data sources about economics and stats. For Euro exchange rates, we have 2 possible data sources which are FREE of access and usage :

  • RSS streams : broadcasted daily, at 14:15 (not a minute more), these RSS are easily accessible and you can leverage them to build your own exchange rate repository. Some data transformation are needed but it is very simple. These RSS streams offer 5 days of historical data. They are available on the ECB website HERE.
  • XML file : like the RSS Stream, a daily XML file is available. It contains only data for the current day. Here again, you can easily load it with Kettle and the XML step with the proper parameters and configuration. The XML file is available on the ECB website HERE.

Let’s see everything in detail.

Solution Nb1 : RSS streams from European Central Bank.

If you go on the RSS page (HERE), you will see a lot of streams available for every currency on the market.

image

The RSS stream is easy to read and understand. Let’s click on the first one : US Dollar. As you can see, we have the currency exchange rate with the Euro and a date. We will need to do some parsing here.

image

Okay, we have now the RSS links and we just had a quick overview of its internal structure, now time to go playing with Kettle. First we put a “RSS Reader” on the workbench and we set it up. As you can see, I added each RSS link corresponding to each currency. No possibility to use a single RSS stream for all currencies (I will investigate this point).

image

On the second tab, nothing to do, just be sure you have a 0 in the field “Max number”.

On the third tab, Fields, we want to choose only 2 fields : “Date de publication” (exchange rate timestamp) and “Titre” (the string holding the exchange rate for the Euro). Let’s use String as datatype. Below is the Field tab.

image

If you hit the preview button, you will see the RSS stream popping out on your screen like this. Cool.

image

Okay, now we have to process our data in order to feed a table, somewhere on your datawarehouse or your application. Let’s have a look at the transformation I did in 3 mins for that purpose.

image

You can see the RSS Reader on the left, no need to go futher on this one. Then some other steps :

image Field split : the field Titre, as we saw it with the RSS Reader, is a long string containing all what we need : the exchange rate and the international currency code (USD, EUR, CHF …). With this step, I split the Titre field into two new fields that will hold the exchange rate (Cours) and the currency code (Devise). The delimter is a space, that’s why you can’t see it on the screeshot below :

image

image RATES data input : We feed the target database / table. Take care to manage your historical data here, remember the RSS stream is sending 5 days of historical data each day.

image Keep single currency : That’s the second part of the transformation. Here, we need to build a table with the couples : currency code / currency name. Remember we only have the currency code (USD …) and it would be nice to build a tiny dimension with the real name of the country and the currency. This step will only keep distinct values.

image

image Map ECB currency code / currency name : the previous distinct values will be mapped with the currency real and long names. Look at the configuration screen below, a new field is created (Devise) and you can copy paste the currency names from the ECB page where we grabbed the RSS links. The currency codes are international standards, no risk to see them changing one morning.

image

image CURRENCIES data input : Final step, we feed the currency dimension with the couples code / currency name. Since it is a typical short dimension and new currencies are not frequent, you can update this dimension once in a while, or when a new RSS is added …

If we make a quick extract of the data we created, the output will look like this for the rates (left) and the currencies (right).

image image

Solution Nb2 : XML file from the European Central Bank.

Well, doing the same with an XML input is possible and easy too. First, we need to find the appropriate XML file. This one can be found HERE. It is quite simple and interesting data is the timestamp, the currency and the rate. Remember, this XML file only contain data for one day.

image

This XML file is available everyday at 14:15, so you can schedule your job to run in order to gather the lastest data.

Let’s process this file now. For this, we will create a transformation looking like this one below. We will also create a currency dimension table, like we did for the previous example.

image

image XML Extract : this is the core component of this transformation. It can read an XML file, parse it, process it, based on your Xpath query. Let’s have a look about configuration.

image

The link to the XML file has to be written in the main tab. The second tab is more sensitive : here we have to specify a XPath for the document. In our case, the XPath must be : /gesmes:Envelope/*[name()='Cube']/*[name()='Cube']/*[name()='Cube']

image

The last tab (Fields) is also very important : we need to indicate the XPath attributes in order to reach the elements we need. In our case, @currency, @rate and @time are mandatory.

image

image RATES : the XML file is directly written into a target database / table. No need for custom transformation here. The target data looks like the previous example.

image Map ECB currency code / country : we still need to create a tiny dimension with the couples :currency code / currency full name. Same process as the previous example. Luckily, the currency codes are a worldwide standard and we can re use the step from the previous transformation.

image

image CURRENCIES : finally, the currency dimension is written into its target database / table.

The rates are on the left while the currencies – inchanged – are on the right. Remember : only one day of data is available with the XML file. You will maybe notice that the date format is different compared to the RSS data (yyyy-MM-dd versus dd/MM/yy) but this is something you can easily manage if necessary.

image image

Well, this was a quick and handy way to reach some official currency data and process it in Kettle. Of course, you can easily customize and optimize these jobs.

If you have troubles running theses examples, feel free to reach me and I will provide you with the transformation files.