Today, a quick post to demonstrate how to create some spatial reporting using simple javascript and Jasper server. Hey, I was about to forgot … everything is hosted on Amazon Cloud Computing of course ;)).
Here is the scenario :
- Extract data from database : french departments and a simple KPI : total number of contacts.
- Create an XML file for the extracted data because we don’t want live queries running on the database. Regarding the limited amount for data we need, it’s better to query a simple xml file here.
- Add spatial coordinates (GPS coordinates for each french department) using Google API or Yahoo API.
- Implement some javascript to :
- Call a google map,
- Place markers on the map, for each french department.
- Add some html to display the values for each map marker (number of contacts).
Data files
Ok, let’s go : extract data and generate XML file containing our data. Easy, here is the output using internal xml functions of Posgresql. Below we have an excerpt showing the structure :- name : number for french department (from 01 to 95)
- nb_conctacts : our main KPI, the number of contacts
- lat and lng : latitude and longitude.
I will create two files : one for Paris and suburbs, the other one for whole french territory. Like this I will be able to choose between a focus on Paris (economic center) or the rest of the country. The names are 'cp_stats-idf.xml' (Paris and suburbs) and 'cp_stats-province.xml' (rest of the country).
<?xml version="1.0" encoding="ISO-8859-1" standalone="no"?>
<markers>
<marker>
<name>01</name>
<nb_contacts>39600</nb_contacts>
<lat>46.24757</lat>
<lng>5.1307683</lng>
</marker>
<marker>
<name>02</name>
<nb_contacts>25507</nb_contacts>
<lat>49.47692</lat>
<lng>3.4417367</lng>
</marker>
<marker>
<name>03</name>
<nb_contacts>14143</nb_contacts>
<lat>46.311554</lat>
<lng>3.4167655</lng>
</marker>
<marker>
<name>04</name>
<nb_contacts>14814</nb_contacts>
<lat>44.077873</lat>
<lng>6.2375946</lng>
</marker>
<markers>
Coding
Now, let’s use some Javascript. First, we need the jQuery library, written by John Resig (http://jquery.com/). Download it and put the library in your project directory.Now, let’s code the second Javascript file, the one that will create the Google Map and place the markers. Here is the code, I called it ‘google_put_markers.js’.
$(document).ready(function() {
$("#map").css({
height: 500,
width: 700
});
var LatLngCoord= new google.maps.LatLng(48.859112, 2.346800);
MAP.init('#map', LatLngCoord, 11);
$("#show_PAR").click(function(e){
MAP.PutMarkers('cp_stats-idf.xml');
});
$("#show_PRO").click(function(e){
MAP.PutMarkers('cp_stats-province.xml');
});
});
var markersArray = [];
function clearOverlays() {
if (markersArray) {
for (i in markersArray) {
markersArray[i].setMap(null);
}
}
}
var MAP = {
map: null,
bounds: null
}
MAP.init = function(selector, latLng, zoom) {
var myOptions = {
zoom:zoom,
center: latLng,
mapTypeId: google.maps.MapTypeId.ROADMAP
}
this.map = new google.maps.Map($(selector)[0], myOptions);
this.bounds = new google.maps.LatLngBounds();
}
MAP.PutMarkers= function(filename) {
clearOverlays();
$.get(filename, function(xml){
$(xml).find("marker").each(function(){
var name = $(this).find('name').text();
var address = $(this).find(nb_contacts).text();
var lat = $(this).find('lat').text();
var lng = $(this).find('lng').text();
var point = new google.maps.LatLng(parseFloat(lat),parseFloat(lng));
MAP.bounds.extend(point);
var image = 'logo.png';
var marker = new google.maps.Marker({
position: point,
map: MAP.map,
title:"Statistiques",
icon: image
});
var infoWindow = new google.maps.InfoWindow();
var html='<strong>Département : '+name+'</strong.><br />'+address + ' contacts';
markersArray.push(marker);
google.maps.event.addListener(marker, 'click', function() {
infoWindow.setContent(html);
infoWindow.open(MYMAP.map, marker);
});
MAP.map.fitBounds(MAP.bounds);
});
});
}
As you can see, we first create a map, centered on France / Paris. We have several functions for cleaning the map (when changing point of view between regional and Paris), placing markers (two buttons) on that map and displaying infowindows.
HTML
Ok, almost done. Now we need a simple html file to put everything in it. Here is the file. As you can see, I created two buttons : one for displaying the markers for the whole french territory, and the other for displaying only markers for the core economic center (Paris and suburb). I call this file ‘display_geostats.html’.<!DOCTYPE html>
<html>
<head>
<title>Google Maps</title>
<script type="text/javascript" src="http://maps.google.com/maps/api/js?sensor=false"></script>
<script type="text/javascript" src="js/google_put_markers.js"></script>
<script type="text/javascript" src="js/jquery-1.4.1.min.js"></script>
</head>
<body><div id="map"></div>
<div ><input type="button" id="show_PAR" value="Paris et region parisienne" /><input type="button" id="show_PRO" value="Province" /></div>
<div ></div>
</body>
</html>
Last checking
Ok, this is what we should have now : two XML data files, a javascript directory (called typically ‘js’) containing two files (the jquery lib and the file for displaying the markers I called ‘google_put_markers.js’), and the logo file (png). Below the snapshot of my setup.

Let’s test it
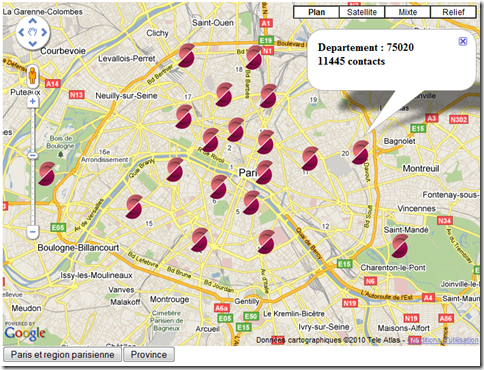
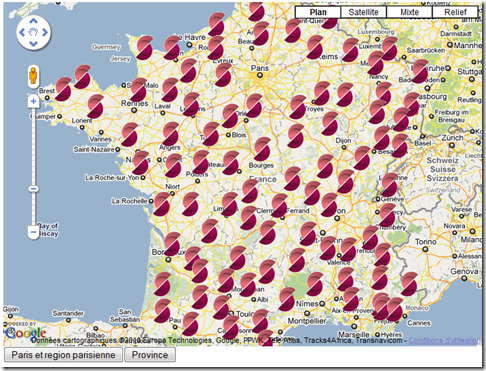
Ok, now let’s open the html file. You should have something like below. By default, the we can see the view called ‘Province’ which means ‘the whole country’ (pic 1). Each french department has a marker (on this map the marker represents the logo of the company I’m currently working for). If we click one of this marker, we will display the typical Google Map html box with the KPI called ‘number of contacts” in it (pic2).Ps : better results with Firefox …
Now let’s click on the button ‘Paris et region parisienne’ (means Paris and the suburbs) and we will display a different map : a zoom on Paris and new markers for this region.

JasperSoft / JasperServer integration
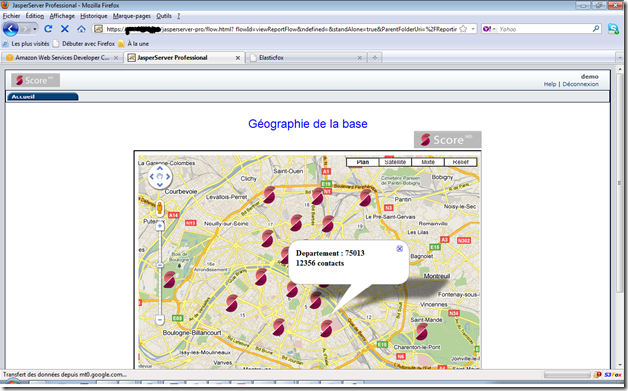
Ok, now we need to implement everything into JasperServer. Easy, deploy the whole directory we created above (html renamed into jsp file, data files, js directory with the two javascript files). Create the report like you would do for any other report and then you are ready to display it inside your JasperServer portal.Sorry, I can’t give you the portal address … ;)

Summary
This was a very simple (and short) example on how to :- generate maps with Google Maps,
- Place markers on this map
- Display dynamic information (coming from db) inside the markers
- Put everything, simply, into JasperSoft portal.
Please feel free to contact me for deepest explanations or more details.
Next article to come will be about using a dozen lines of java to run geocoding lookups with Google or Yahoo (quickest !).


2 comments:
Nice hack! Maybe you can be interested in investigate also the loaction intelligence functionalities that another open source BI Suite like SpagoBI offers directly out of the box. Here you can find some intersting resources:
- http://bit.ly/9PZ7xY
- http://bit.ly/b9TLTB
- http://www.geobi.org
Regards,
Andrea Gioia
great post thanks
Post a Comment