I would like to start a collection of posts dedicated to PDI / Kettle clustering.
After surfing the web, I noticed a lot of people is asking how to build PDI clusters, how to test and deploy them in a production environment. Also a lot of questions about Carte usage. So, I will try to make some tutorials about this fantastic feature offered by PDI.
At that time, I want to recommend you a book : “Pentaho Solutions – Business Intelligence and Datawarehousing with Pentaho and MySQL”, written by Roland Bouman and Jos Van Dongen. This book is a fantastic source of knowledge about Pentaho and will help you understanding the Pentaho ecosystem and tools. My complete review about this book here.
Agenda
- How to build a simple PDI cluster (1 master, 2 slaves). This post.
- How to build a simple PDI server on Amazon Cloud Computing (EC2).
- How to build a PDI cluster on Amazon Cloud Computing (EC2).
- How to build a dynamic PDI cluster on Amazon Cloud Computing (EC2).
This first post is about building a simple PDI cluster, composed of 1 master and 2 slaves, in a virtualized environment (vmware).
After this article, you will be able to build your PDI cluster and play with it on a simple laptop of desktop (3 giga of ram is a must have).
Why PDI clustering ?
Imagine you have to make some very complex transformations and finally load a huge amout of data into your target warehouse.
You have two solutions to handle this task :
- SCALE UP : Build a strong unique PDI server with a lot of RAM and CPU. This unique server (let’s call it an ETL hub) will handle all the work by itself.
- SCALE OUT : Create an array of smaller servers. Each of them will handle a small part of the work.
Clustering is scaling out. You divide the global workload and distribute it accross many nodes, these smaller tasks will be processed in parallel (or near parallel). The global performance equals the slowest node of your cluster.
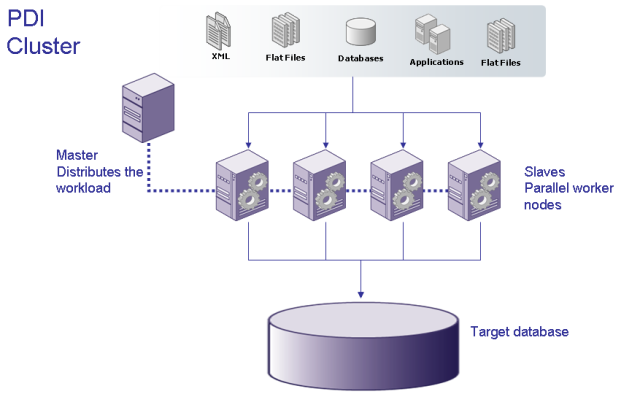
If we consider PDI, a cluster is composed of :
- ONE MASTER : this node is acting like a conductor, assigning the sub-tasks to the slaves and merging the results coming back from the slaves when the sub tasks are done.
- SLAVES : from 1 to many. The slaves are the nodes that will really do the job, process the tasks and then send back the results to the master for reconciliation.
Let's have a look to this schema. You can see the typical architecture around a PDI cluster : data sources, the master, the registered slaves and the target warehouse. The more PDI slaves you implement, the better parallelism / performance you have.
The virtual cluster
Let's build our first virtual cluster now. First, you will need vmware or virtual box (or virtual PC from Ms). I use vmware, so from now I will speak about vmware only, but you can transpose easily. I decided to use Suse Enterprise Linux 11 for these virtual machines. It is a personal choice, but you can do the same with Fedora, Ubuntu, etc …
Let's build 3 virtual machines :
- The Master : Suse Enterprise Linux 11 - this machine will host PDI programs and PDI repository, a mysql database with phpmyadmin (optional).
- The Slave 1 : Suse Enterprise Linux 11 - this machine will host PDI programs and will run carte.
- The Slave 2 : Suse Enterprise Linux 11 - this machine will host PDI programs and will run carte.
As you can see below, the three virtual machines are located on the same subnet, using fixed IP adresses ranging from 192.168.77.128 (Master) to 192.168.77.130 (Slave 2). On the vmware side, I used a "host only" network connection. You have to be able to ping your master from the two slaves, ping the two slaves from the master and also ping the three virtual machines from your host. The easiest way is to disable the firewall on each Suse machine because we don't need security for this exercise.

The Master configuration
As I said, the Master virtual machine is hosting PDI, a mysql database and the PDI repository. But let's have a closer look to the internal configuration, especially with the Carte program config files.
From Pentaho wiki, Carte is "a simple web server that allows you to execute transformations and jobs remotely". Carte is a major component when building clusters because this program is a kind of a middleware between the Master and the Slave servers : the slaves will register themselves with the Master by notifying they are ready to receive tasks to process. On top of that, you can reach Carte web service to remotely monitor, start and stop transformations / jobs. You can learn more on Carte from the Pentaho wiki.
The picture below explains the registration process between slaves and a master.

On the Master, two files are very important. The files are configuration files, written in XML. They are self explanatory, easy to read :
- Repositories.xml : your slave must have a valid repositories.xml file, updated with all informations about your repository connexion (hosted on the Master for this example). See below for my config file.
- Carte xml configuration file : located in /pwd/, this file contains only one section for defining the cluster master (ip, port, credentials). In the /pwd/ directory, you will find some example configuration files. Pick one, for instance the one labelled "8080" and apply the changes described below. I will keep the port 8080 for communication between the Master and the two Slaves. See below for my config file.
Repositories.xml on Master

Carte xml configuration file on Master 
The Slave configuration
As I said, the two Slave virtual machines are hosting PDI. Now let's have a look on how to configure some very important files, the same files we changed for the Master.
- Repositories.xml : your slave must have a valid repositories.xml file, updated with all informations about your repository (hosted on the Master for this example). See below for my config file.
- Carte xml configuration file : located in /pwd/, this file contains two sections : the master section and the slave section. In the /pwd/ directory, you will find some example configuration files. Pick one, for instance the "8080" one and apply the changes described below. Note that the default user and password for Carte is cluster / cluster. Here again the file is self explanatory, see below for my config file.
Repositories.xml on Slave1 and Slave2 :
Same as for the Master, see above.
Carte xml configuration file on Slave1 (note address is 192.168.77.128, don’t write “localhost” for Slave1)

Carte xml configuration file on Slave2 (note : address is 192.168.77.130, don’t write “localhost” for Slave2)

Starting everything
Now it is time to fire the programs. I assume you have already started mysql and your PDI repository is active and reachable by PDI. It is quite recommended that you work with a repository hosted on a relational db. Let's fire Carte on the Master first. The command is quite simple : ./carte.sh [xml config file].

This output means that your Master is running and a listener is activated on the Master adress (ip address) on port 8080. Now let's start the two slaves. Here again, the command is simple : ./carte.sh [xml config file]. Look below the output for the Slave1, you can see that Carte has now registered Slave1 (192.168.77.129) to the master server . Everything is working fine so far.

Finally the output for Slave2. Look below the output for the Slave2, you can see that Carte has now registered Slave2 (192.168.77.130) to the master server . Everything is fine so far here again.

At that point, we have a working Master and two registered slaves (Slave1 and Slave2) waiting to receive tasks from the Master. It is time, now, to create the cluster array and a PDI transformation (and a job to run it). Let's go for it.


    PDI configuration   First we have to declare the slaves previously created and started. That's pretty easy. Let's select the Explorer mode on the left pane. Do a left click on the "Slave server" folder, this will pop up a new window in which you will declare Slave1 like below.


Repeat the same operation for Slave1 and Slave2 in order to have 3 registered servers like the picture above. Don't forget to type the right ip port (we are working with 8080 since the begining of this exercise).

Now we have to declare the cluster. Right click on the cluster folder (next folder) and choose New. This will pop up a new window in which you will fill the cluster parameters : Just type a new name for your cluster and then click on the "select servers" button. Now choose your three servers and click ok. You will then notice your cluster is created (Master and Slave) like below.


      Creating a job for testing the clusterFor this exercice, I won't create a job but will use an existing one created by Matt Casters. This transformation is very interesting and will only read data from a flatfile and compute statistics in a target flatfile (rows/sec, throuput ...) for each slave. You can download this transformation here, the job here and the flat file here (21 Mo zipped).

I assume you know how link a transformation into a job. Don't forget to change the flatfile location on source (/your_path/lineitem.tbl) and on destination (/your_path/out_read_lineitems). Then, for each of the first four steps, right click and assign the cluster (you named previously, see above) to the step. You will see the caption “Cx2” on top right of each icon. There is nothing else to change. Here is a snapshot of the contextual menu when assigning the cluster to the transformation steps (my PDI release is in french, so you have to look at “Clustering” instead of “Partitionnement”).


      Have a look to the transformation below. The caption “Cx2” on top right of the first four icons means you have assigned your cluster to run these steps. On the contrary, the JavaScript step “calc elapsed time” won’t run on the cluster but on the Master only.

And have a look to the job (calling the transformation above). This is a typical job, involving a start step and the “execute transformation” step. We will start this job with Kitchen later.

      Running everything

Now it is time to run the job/transformation we made. First we will see how to run the transformation within Spoon, the PDI gui. Then we will see how to run the job (containing the transformation) with pan in the linux console and how to interpret the console output.       First, how to start the transformation within Spoon. Simply click on the green play symbol. The following window will prompt at your screen. Once again, my screen is in french, sorry for that. All you have to do/check is to click on the top right button to select the clustering execution (“Exécution en grappe” in french). I suppose you are already quite familiar with that screen so I won’t continue explaining it.

      Then you can run the transformation. Let’s have a look at the Spoon trace (don’t forget to display your output window in PDI, and select the Trace tab).


This trace is fairly simple. First we can see that the Master (ip .128)found his two slaves (ip .129 and ip .130) and the connexion is working well. The Master and the two Slaves are communicating all along the process. As soon as the two Slaves have finished their work, we receive a notification '(All transformations in the cluster have finished”), then we can read a small summary (nb of rows).

Let’s have a look on the Master command line (remember we started Carte by using the Linux command line). For the Master, we have a very short output. The red lines are familiar to you now, they correspond to Carte startup we did a few minutes ago. Have a look below on the green lines : these lines were printed out by Carte while the cluster was processing the job.
                Let’s have a look at Slave 1 output. Here again, the red lines are coming from Carte Startup. The green lines are interesting : you can see Slave 1 receiving its portion of the job to run … and how he did it by reading rows (packets of 50000). You can also notice the step names that were processed by the Slave 1 in cluster mode : lineitem.tbl (reading flatfile), current_time (catch current time), min/max time and slave_name. If you remember well, these steps were flagged with a “Cx2'” on their icon on top right corner (see below) when you assigned your cluster to the transformation steps.


                    The output for Slave 2, displayed below, is very similar to Slave 1.

                        That’s very funny to do ! Once you started Carte and created your cluster, you are ready to execute the job. Then you will see your linux console printing informations while the job is being executed by your slaves. This post is about understanding and creating the whole PDI cluster mecanism, I won’t talk about optimization for the moment.
            Hey, what’s the purpose of my transformation ?

As I said before, this transformation will only read records from a flatfile (lineitem.tbl) and compute performance statistics for every slave like rows/secs, throuput … The last step of your transformation will create a flatfile containing these stats. Have a look at it.
              Once formated with a spreadsheet tool, the stats will look like this.                              Don’t pay too much attention to the start_time and end_time timestamps : the time setup was not done on my three virtual machines, hence they are not in synch. You will also notice that, in the exemple above, the performances for these two slaves are not homogeneous. That’s normal, don’t forget I’m currently working on a virtualized environment built on a workstation and this tutorial is limited to demontrating how to create and configure a PDI cluster. No optimization was taken in account at that time. On a fully optimized cluster, you will have (almost) homogeneous performance.

Running with the linux Console

If you want to execute your job from the linux command line, no problem. Kitchen is here for you. Here is the syntax for a job execution. Note : VMWARE-SLES10-32_Repo is my PDI repository running on the Master. I’m sure you are already familiar with the other parameters.                                              For executing your transformation, use pan. Here is the typical command.
Conclusion and … what’s next ?

Well, I hope you found here some explanations and solutions for creating basic PDI clustering. You can create more than 2 slaves is you want, the process is the same. Don’t forget to add these new slaves in the cluster definition in Spoon. As I said, no particular attention was given on optimization. This will be the topic for a next post in the near future. Feel free to contact me if you need further explanations about this post or if you want to add some usefull comments, I will answer with pleasure.                  Next post will be about creating the same architecture, with … let’s say 3 or 4 slaves, in the Amazon Cloud Computing infrastructure. It will be a good time to speak about could computing in general (pros, cons, architecture …).


 I started to test GeoKettle. Quite interesting.


